The Austin Office Market in Q3 2026: The Last Big Tower Lands
▲ from ~$44 in September
▲ 0.2 pts from September
▲ from 2.5M in September
▼ from ~1.1M in September
Austin office market, Q3 2026. Source: CoStar, data as of October 17, 2026. September comparisons are to our mid-September update.
Our take: the easy space is going away
Austin still has plenty of empty offices, but not the kind most tenants want. Good space in the newest buildings is being taken a floor at a time, nothing of size is being built behind it, and landlords in those buildings have started holding their numbers. If your lease ends in the next 18 months, the best deals of this cycle are the ones you negotiate now, not next year.
Austin’s office market just passed a milestone: the last major tower of the building boom is finished. Waterline has delivered downtown, and there is nothing of its size behind it. Vacancy is still high, but tenants have taken more space than they’ve given back every quarter this year, rents held, and the pipeline of new buildings has shrunk to a fraction of what delivered over the past year.
Here’s where things stand at the end of the third quarter, with the numbers courtesy of CoStar’s current Austin office report (data as of October 17, 2026).
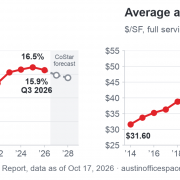
The chart at the top of this post shows twelve years of it: vacancy more than doubled from 2017 to 2025 and has now turned down, while rents never stopped climbing. The gray band is CoStar’s forecast.
The market at a glance
- Vacancy: 15.9% — down half a point from a year ago. Still well above Austin’s long-run average of about 11%, but no longer climbing. CoStar’s forecast has it drifting down to about 14.8% next year.
- Net absorption: about 2.8 million SF over the trailing twelve months, including roughly 800,000 SF in the third quarter alone. Absorption has been positive in each of the first three quarters of 2026.
- Asking rents: about $46/SF full-service on average, up 3.1% year over year. Landlords are holding face rents and competing with free rent and improvement dollars instead.
- Under construction: about 764,000 SF across 53 buildings, roughly half of it already leased. About 2.5 million SF delivered over the past year; CoStar expects 2027 deliveries to fall to about 113,000 SF.
What it costs, by building class
- Class A (4–5 Star): about $58/SF asking, with 21.4% vacancy. On a triple-net basis, the CBD and Domain run roughly $38–$46/SF NNN, the newest trophy towers about $53, and comparable suburban buildings in the Northwest and Southwest closer to $24–$33.
- Class B (3 Star): about $39/SF, with 12.8% vacancy.
- Class C (1–2 Star): about $35/SF, with 11.4% vacancy.
The pattern from earlier this year is holding: the newest, most expensive buildings carry the most empty space and also get nearly all of the demand. Buildings finished since 2020 absorbed about 1.3 million SF this year, while older Class A buildings gave back roughly 430,000 SF. If your building is older than 2020, you’re competing on price and concessions.
Rent and vacancy by area
| Area | Asking rent | Vacancy | 12-mo absorption |
|---|---|---|---|
| Downtown | $62.26 | 22.3% | +171,000 SF |
| East | $51.65 | 26.8% | +178,000 SF |
| North & Domain | $48.38 | 11.5% | −51,000 SF |
| South | $46.03 | 20.3% | +9,000 SF |
| Southwest | $44.68 | 12.1% | +84,000 SF |
| Northwest | $39.49 | 18.0% | +1,202,000 SF |
| Central | $38.02 | 9.2% | −58,000 SF |
| Cedar Park | $37.33 | 10.2% | +7,000 SF |
| Round Rock | $37.23 | 4.8% | +449,000 SF |
| Austin overall | $45.68 | 15.9% | +2,800,000 SF |
Average asking rent, full-service, per SF per year. Absorption is net space taken over the trailing twelve months. Source: CoStar, Q3 2026.
Downtown is still the most expensive address in the market, with 22% of it vacant. East Austin is next and carries the highest vacancy in the city at nearly 27%. For value, look west and north: Northwest Austin absorbed 1.2 million SF over the past year, more than any other submarket, and Round Rock remains the tightest of the major submarkets at under 5% vacancy.
Where the deals are
The third quarter’s big signatures were a mix of law, tech, and engineering: Jackson Walker took 117,000 SF at The Republic downtown, Tesla signed 82,000 SF at 717 Parmer, Qualcomm committed to 66,000 SF at Parmer Business Park, Virtu Financial added 54,000 SF at The Republic, and Freese and Nichols took 39,000 SF at Quarry Oaks III in the Northwest.
On the sales side, office buildings have changed hands at a faster clip this year: about $681 million across 326 sales through the third quarter, at an average of roughly $336 a foot. One Eleven Congress sold for $208 million in July (about $400 a foot), 405 Colorado went for $151 million (about $733 a foot for a new downtown tower), and Research Park Plaza V in the Northwest traded for $42 million at a 9.9% cap rate. Prices overall are still about 17% below their 2021 peak, which is exactly why buyers are back.
Q3 in the news
- What’s inside Waterline, Texas’ tallest building — KUT, Sept. 14. The 74-story tower opened two months early with about 700,000 SF of offices, a hotel, and apartments.
- One Eleven Congress trades for $208M — Connect CRE, July 31. Cousins sold the 30-story tower to Fort Worth’s Canyon Creek Real Estate.
- 405 Colorado sells to Hines for $151M — Connect CRE, July 13. The 25-story, fully leased tower was part of Brandywine’s asset-sale plan.
- The Republic passes 70% leased — Commercial Property Executive, Aug. 20. Jackson Walker and Virtu Financial took the 48-story tower to 73% leased.
- Endeavor breaks ground on 5th & Walsh — REBusinessOnline, Sept. 14. The 198,000 SF office-and-retail project near downtown is the only sizable office start of the quarter, with shell completion in late 2028.
What this means for you
If you’re a tenant, you still have leverage, and this is the quarter to use it. Vacancy near 16% means landlords are competing for good credit with free rent and TI dollars, especially in the newer buildings where the empty space is concentrated. But with Waterline delivered and almost nothing starting behind it, the supply of large, high-quality blocks will thin through 2027. CoStar’s forecast has vacancy drifting down to about 14.8% next year and rent growth picking up. If your lease expires in the next 12–18 months, start now.
If you’re an owner, the numbers are moving your way: positive absorption every quarter this year, a pipeline that is nearly empty, and sale prices that have stopped falling. But tenants are still shopping hard and choosing the newest, best-located space. Buildings that are priced honestly and marketed actively are leasing. Overpriced or quietly listed space is not.
What the averages can’t tell you is your building, your block, and your timing. If you want a read on your specific situation — what your space should rent for, or what you should be paying — that’s the question we answer every day.
Source: CoStar Austin Office Market Report, data as of October 17, 2026. See our Austin Office Market guide for the full rate and vacancy picture, or browse office space by area: Downtown, Central, North & Domain, Northwest, South, Southwest, East, Cedar Park & Round Rock.